Manure Analysis |

|

|
|
Manure Analysis |

|

|
|
|
||
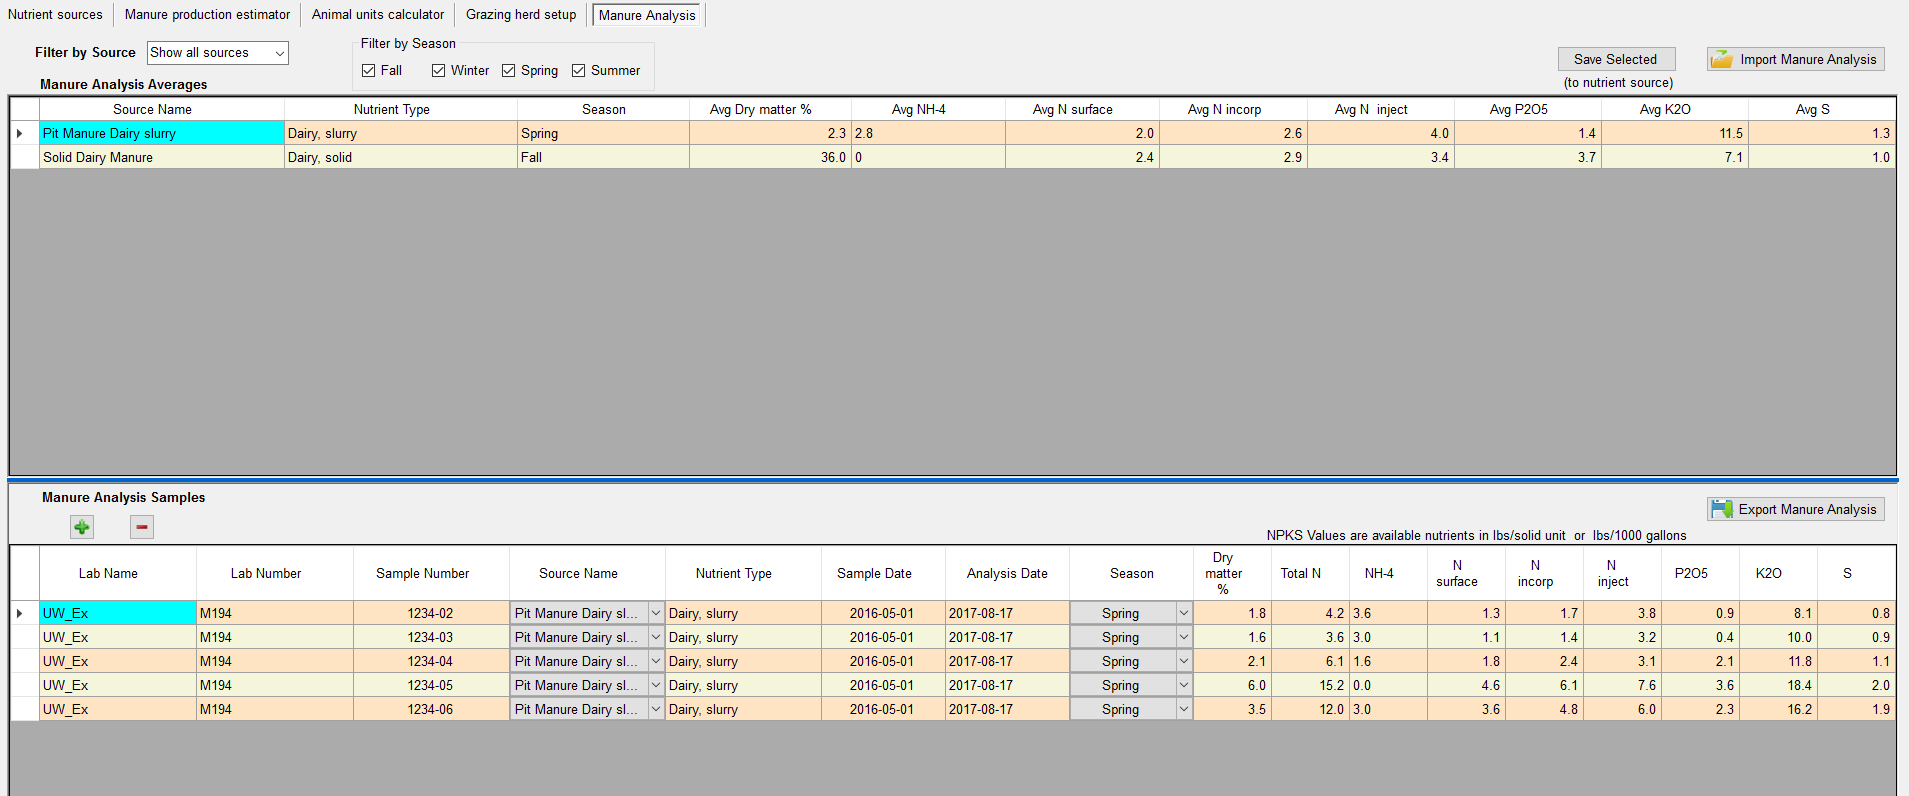
This screen manages your manure analysis data. Running averages by season are kept for each manure source. Averages are currently calculated individually for N, P2O5, K2O, and S for each year/season combination. The calculation throws out up to two sample values if they are more than 2 standard deviations from the mean. This means that the N value for a sample may be used but the P2O5 value for the same sample may be thrown out.

The controls
•Filter by source combo box will filter the displayed data showing samples and averages for the selected source.
•Filter by season check boxes will filter the displayed data showing samples and averages for the selected seasons.
•Save Selected will copy the selected averages to the nutrient source for the years you select.
•![]() Import data from an Excel file. An import template ‘SampleFarmManureAnalysis.xls’ is installed in the Import folder. This can also be opened by clicking on Help, then going to Reference Docs (N to Z), and then Template Manure Analysis.xls. If the source name in the import file is different from the currently defined sources in the Nutrient sources tab, you will need to pick an existing source from the drop down menu or go back to Nutrient sources and add the new source name before importing the analysis.
Import data from an Excel file. An import template ‘SampleFarmManureAnalysis.xls’ is installed in the Import folder. This can also be opened by clicking on Help, then going to Reference Docs (N to Z), and then Template Manure Analysis.xls. If the source name in the import file is different from the currently defined sources in the Nutrient sources tab, you will need to pick an existing source from the drop down menu or go back to Nutrient sources and add the new source name before importing the analysis.
•![]() Export the grid data to an an Excel file
Export the grid data to an an Excel file
•Manure Analysis Averages: This grid displays the averages for each source for each season. This grid is read only. It automatically updated when the sample data changes.
•Manure Analysis Samples: This grid is used to hand enter manure analysis sample data.
![]() Add a new sample row.
Add a new sample row.
![]() Delete the selected sample row
Delete the selected sample row
Once you hand enter samples under the manure analysis samples box, they will appear as an average on the top. If you decide you need to look at or edit samples, click on the source name you would like to edit in the Manure Analysis Averages and all the samples will show up on the bottom Manure Analysis Samples for that source. Here you can edit or look at any of the samples if need be.